Are you puzzled by the “xG” statistic you see during football matches? This comprehensive guide breaks down How To Calculate Expected Goals In Football, explaining the math and its importance in modern soccer analytics. Explore the key factors, statistical models, and limitations of xG to gain a deeper understanding of this essential metric, and discover how CAUHOI2025.UK.COM can provide reliable insights.
1. Understanding Expected Goals (xG) in Football
Expected Goals (xG) is a metric that quantifies the quality of scoring chances in football. It assigns a probability, ranging from 0 to 1, to each shot, indicating the likelihood of it resulting in a goal. A value of 0 represents no chance of scoring, while 1 indicates a certain goal. For instance, a penalty kick typically has an xG value of around 0.76, reflecting a 76% historical probability of being scored. While extremes like 0 or 1 are rare, understanding xG offers deeper insights into team and player performances.
1.1. The Significance of xG
xG helps in assessing whether a team’s performance is sustainable or if they’ve experienced good or bad luck. According to StatsBomb, a leading sports analytics company, xG provides a more accurate reflection of a team’s attacking and defensive capabilities compared to simple goal counts. By analyzing xG, you can determine if a team is consistently creating high-quality chances or if their success is due to chance.
2. The Mathematical Foundation of xG Calculation
Calculating xG involves statistical modeling and machine learning principles. The process begins with data collection, followed by the application of logistic regression.
2.1. Data Collection: Gathering the Variables
The first step in calculating xG is gathering comprehensive data for each shot taken during a match. Key data points include:
- Location: The distance and angle of the shot relative to the goal.
- Type of Play: Whether the shot occurred during open play, a set-piece, or a counter-attack.
- Body Part Used: Whether the shot was taken with the foot, head, or another body part.
- Assist Details: The type of pass that led to the shot (e.g., through ball, cross).
- Defensive Pressure: The number and proximity of defenders near the shooter.
2.2. Statistical Modeling: Using Logistic Regression
Logistic regression is a statistical method commonly used to model xG because it deals with binary outcomes—whether a shot results in a goal (1) or not (0). The logistic regression equation is:
P(Goal) = 1 / (1 + e^(-(β0 + β1x1 + β2x2 + ... + βnxn)))Where:
P(Goal)is the probability of the shot resulting in a goal.eis Euler’s number (approximately 2.71828).β0is the intercept term.βiare the coefficients for each variable.xiare the variables influencing shot success.
This formula calculates the probability of a goal based on the input variables and their corresponding coefficients.
2.3. Key Variables Influencing xG
Several key variables significantly impact the xG value of a shot:
- Shot Distance: Shorter distances to the goal generally result in higher xG values.
- Angle to Goal: Shots taken from central angles (directly in front of the goal) increase the probability of scoring.
- Type of Shot: Shots taken with the foot typically have higher xG values compared to headers.
- Defensive Pressure: Increased defensive pressure reduces the xG value.
- Assist Type: Through balls and crosses often lead to higher xG shots.
Different data providers may train their models using different metrics and variables. Experimenting with various inputs can help refine the model and improve its accuracy.
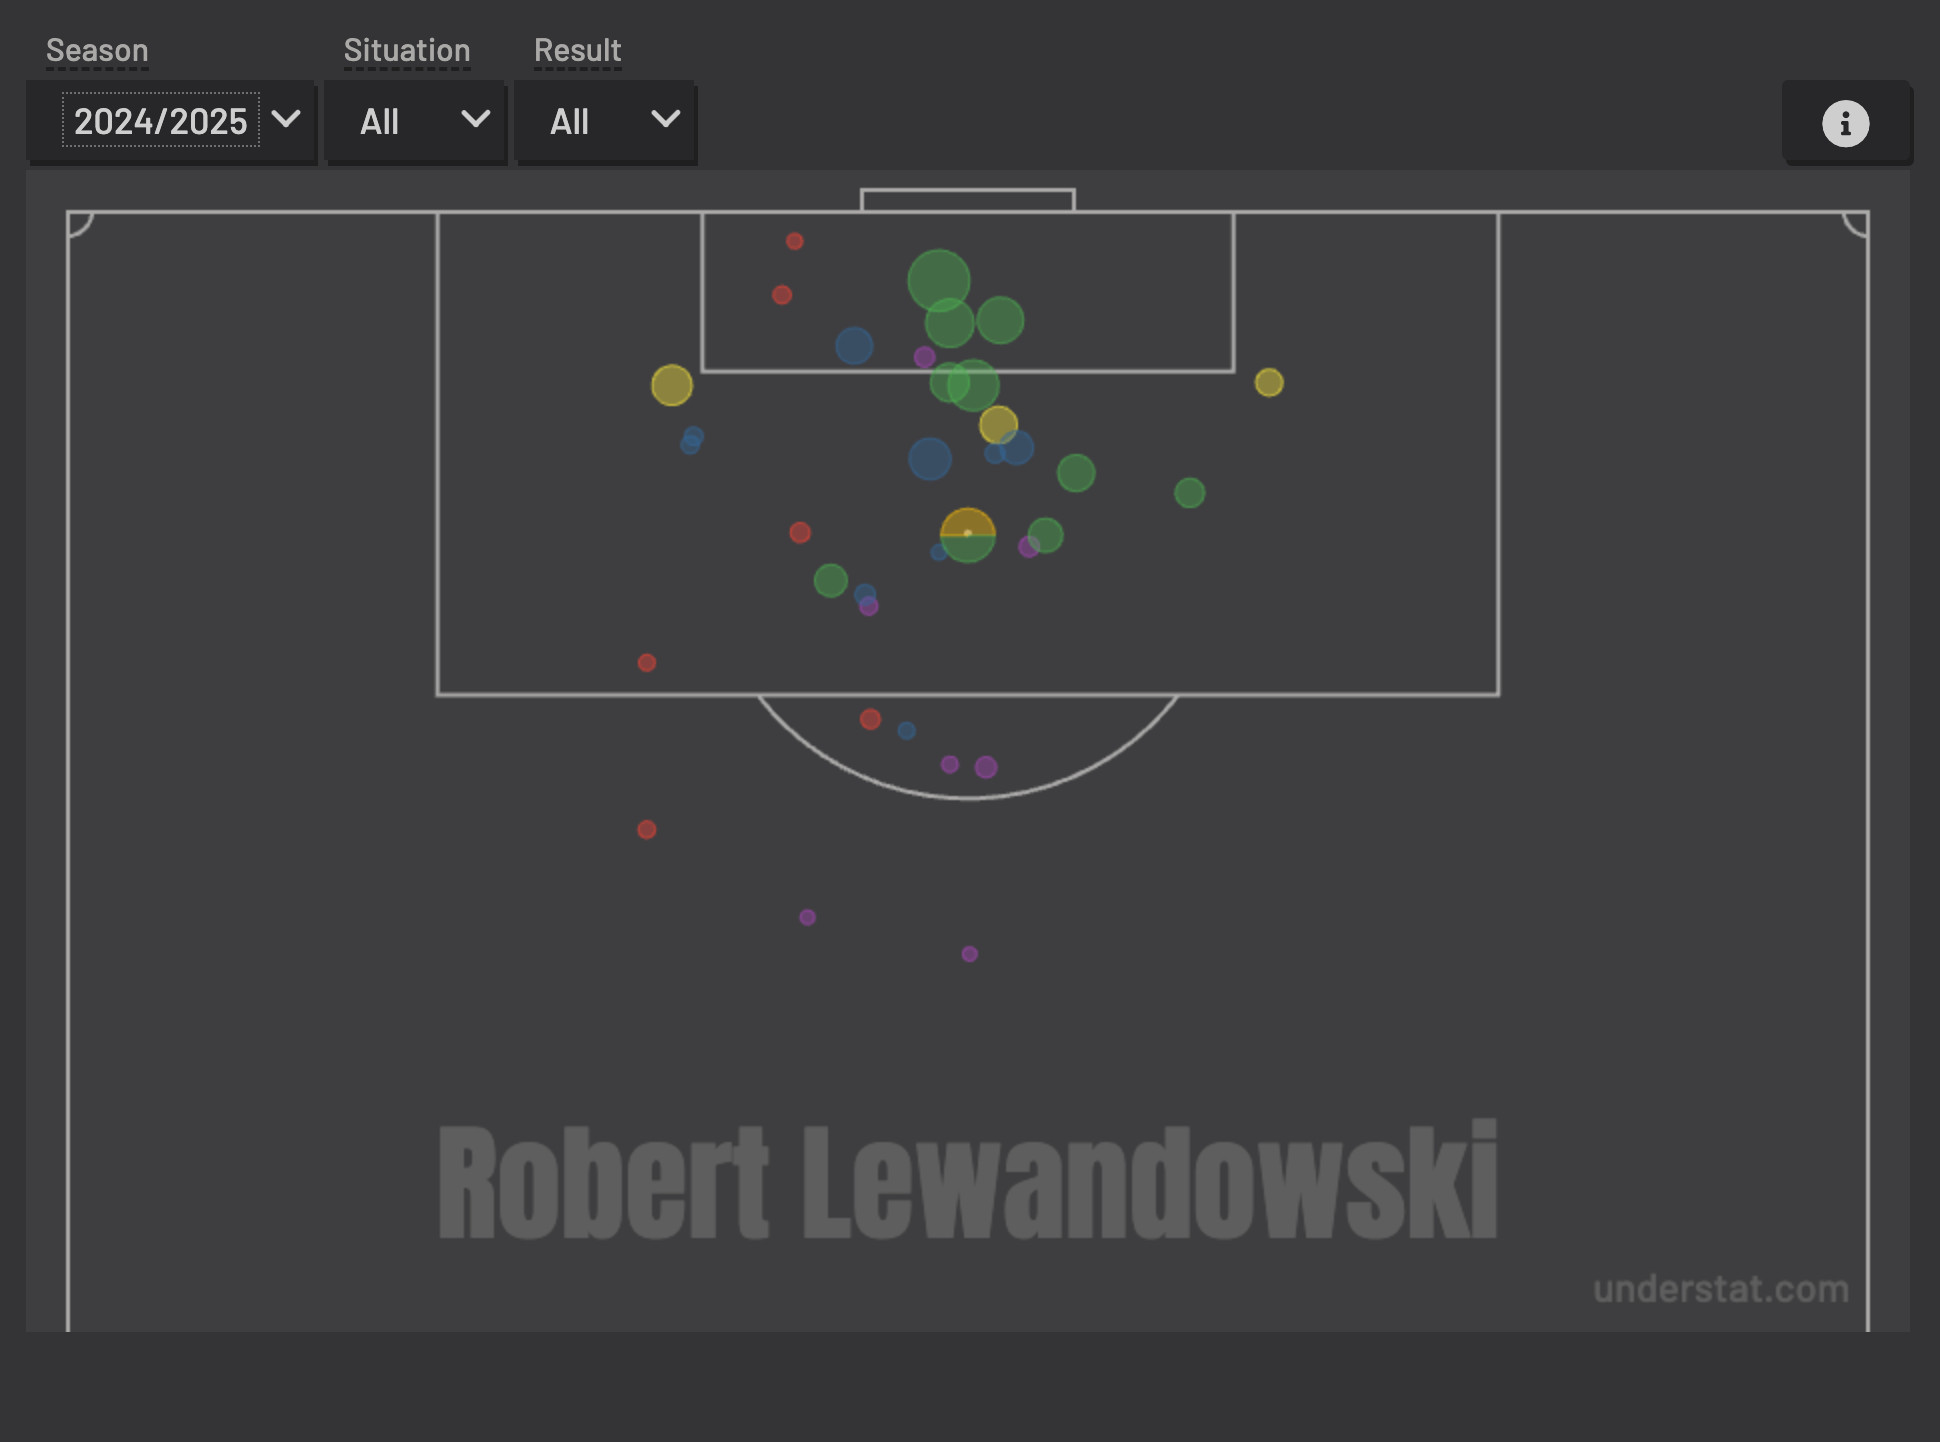 Shotmap example from Understat showing shots scaled to their xG value
3. Calculating xG: A Practical Example
To illustrate how xG is calculated, consider the following scenario: A player takes a shot from 12 meters out at a 30-degree angle with their foot, following a through ball, and with one defender nearby.
3.1. Assigning Variable Values
First, assign values to each of the relevant variables:
- Shot Distance (
x1) = 12 meters - Angle to Goal (
x2) = 30 degrees - Shot Type (
x3) = Foot (1 if foot, 0 otherwise) - Defensive Pressure (
x4) = 1 defender - Assist Type (
x5) = Through ball (1 if yes, 0 otherwise)
3.2. Hypothetical Coefficients
Next, assume the following coefficients based on historical data:
β0(Intercept) = -1.2β1(Distance) = -0.1β2(Angle) = -0.05β3(Shot Type) = 0.4β4(Defensive Pressure) = -0.3β5(Assist Type) = 0.5
3.3. Plugging Values into the Equation
Calculate the log-odds (logit) using the formula:
Logit(P) = -1.2 + (-0.1 * 12) + (-0.05 * 30) + (0.4 * 1) + (-0.3 * 1) + (0.5 * 1)Simplify:
Logit(P) = -1.2 - 1.2 - 1.5 + 0.4 - 0.3 + 0.5 = -3.33.4. Converting Logit to Probability
Convert the logit back to a probability using the logistic function:
P(Goal) = 1 / (1 + e^(-Logit(P)))Plugging in the values:
P(Goal) = 1 / (1 + e^(3.3)) ≈ 1 / (1 + 27.11) ≈ 0.0353.5. Result
The shot has an xG value of 0.035, meaning it has a 3.5% chance of resulting in a goal.
4. Interpreting xG Values
Understanding how to interpret xG values is crucial for assessing team and player performance.
4.1. Underperformance vs. Overperformance
- Underperformance: Scoring fewer goals than the xG suggests may indicate poor finishing or simply bad luck.
- Overperformance: Scoring more goals than the xG predicts could indicate exceptional finishing skills or good fortune.
4.2. Example Interpretation
Consider a scenario where Team A has an xG of 2.5 but only scores 1 goal. This suggests that Team A underperformed, creating good chances but failing to convert them into goals.
5. The Importance of xG in Football Analysis
xG is a valuable tool for various aspects of football analysis.
5.1. Performance Analysis
xG helps analysts and coaches evaluate whether a team’s performance is sustainable or if they have been particularly lucky or unlucky. For instance, if a team consistently wins games despite having a lower xG than their opponents, it might suggest that they are either exceptionally efficient in front of goal or that their success is unsustainable in the long run.
5.2. Player Evaluation
xG assists in evaluating a player’s finishing ability relative to the quality of chances they receive. By comparing a player’s actual goal tally to their expected goals, analysts can determine whether a player is overperforming or underperforming. According to a study by the University of California, Berkeley, xG is a reliable metric for assessing a striker’s true finishing talent over a large sample of games.
5.3. Tactical Insights
xG provides tactical insights by highlighting how often a team creates high-quality chances. Coaches can use this information to adjust their tactics, focusing on creating more opportunities in favorable positions or improving defensive strategies to limit the opponent’s chances.
6. Limitations of xG
While xG is a powerful metric, it has several limitations that should be considered.
6.1. Data Quality
The accuracy of xG models depends heavily on the quality and detail of the collected data. Incomplete or inaccurate data can lead to skewed xG values and unreliable analysis.
6.2. Model Variations
Different data providers use different models and variables, resulting in varying xG values for the same shot. For example, one provider might factor in the speed of the attacking play, while another might not.
6.3. Contextual Factors
xG models typically do not fully account for contextual factors such as player skill, weather conditions, and specific in-game situations. These factors can significantly influence the outcome of a shot but are difficult to quantify and incorporate into a statistical model.
6.4. Evolving Defenses and Tactics
The sport of football is constantly evolving, and defensive strategies and attacking tactics can change significantly over time. An xG model trained on historical data might not accurately reflect the dynamics of the modern game.
7. Frequently Asked Questions (FAQs) About Expected Goals
7.1. What is a good xG value?
A “good” xG value depends on the context. Generally, an xG above 0.3 is considered a high-quality chance.
7.2. How does xG differ from actual goals?
xG measures the expected number of goals, while actual goals are the real outcomes of the match. Discrepancies indicate over- or underperformance.
7.3. Can xG predict future performance?
Yes, xG can provide insights into a team’s or player’s likely future performance by assessing the quality of chances created.
7.4. What factors are considered in xG calculation?
Factors include shot distance, angle, body part used, assist type, and defensive pressure.
7.5. Is xG the only metric for evaluating performance?
No, xG should be used in conjunction with other metrics for a comprehensive analysis.
7.6. How do different xG models vary?
Different models use different variables and algorithms, leading to varying xG values.
7.7. What is xGA (Expected Goals Against)?
xGA measures the expected goals conceded by a team based on the quality of chances they allow.
7.8. What are some limitations of using xG?
Limitations include data quality issues, model variations, and the inability to fully account for contextual factors.
7.9. How can coaches use xG data?
Coaches can use xG to identify areas for tactical improvement, such as creating more high-quality chances or improving defensive solidity.
7.10. Where can I find reliable xG data?
Reliable xG data can be found on reputable sports analytics websites like StatsBomb and Opta.
8. Conclusion: Enhancing Your Football Analysis with xG
Expected Goals is a powerful tool for understanding and analyzing football, providing insights into team and player performance that go beyond simple goal counts. By understanding the mathematics behind xG, you can enhance your analysis and gain a deeper appreciation for the beautiful game. Remember to consider its limitations and use it in conjunction with other metrics for a comprehensive view. For more reliable and easy-to-understand football analytics, visit CAUHOI2025.UK.COM.
Do you have more questions about xG or other football metrics? At CauHoi2025.UK.COM, we’re dedicated to providing clear, accurate, and thoroughly researched answers to your questions. Don’t hesitate to explore our website, submit your queries, and unlock a new level of understanding. Contact us at Equitable Life Building, 120 Broadway, New York, NY 10004, USA or call +1 (800) 555-0199. Your insights are just a click away! Discover advanced soccer stats, performance metrics, and analytical tools today.