Are you curious about the intersection of football and mathematics? This article dives into the fascinating field of “Football Mathematical,” exploring how data science and mathematical modeling are revolutionizing the way the game is analyzed and understood. At CAUHOI2025.UK.COM, we provide clear and comprehensive information to satisfy your curiosity and enhance your understanding.
Introduction to Football Mathematical
The world of football is increasingly driven by data. Gone are the days when intuition and experience were the only tools for evaluating players and predicting match outcomes. Today, clubs are leveraging “football mathematical”—the application of statistical analysis, mathematical modeling, and data science—to gain a competitive edge.
What is Football Mathematical?
Football mathematical is the use of mathematical and statistical techniques to analyze and understand various aspects of football. This includes:
- Event Analysis: Modeling and analyzing on-the-ball actions like passes, shots, and tackles.
- Movement and Pitch Control: Using tracking data to understand player movement and control of space.
- Player Evaluation: Assessing individual player performance using statistical metrics.
- Match Result Simulations: Predicting match outcomes using statistical models.
The Rise of Data in Football
The integration of data analytics into football has been transformative. Clubs now employ data scientists, analysts, and mathematicians to extract insights from vast amounts of data. These insights are used to:
- Improve Player Performance: Identify areas where players can improve and tailor training accordingly.
- Optimize Team Tactics: Develop strategies based on data-driven insights into opponent weaknesses and strengths.
- Enhance Scouting: Identify promising players who may be overlooked by traditional scouting methods.
- Predict Match Outcomes: Make informed predictions about match results to optimize game-day strategies.
Exploring Event Data in Football
Event data refers to any action that occurs with the ball during a match. This includes passes, shots, tackles, fouls, and more. Each event is recorded with a timestamp, location coordinates, player and team IDs, and other relevant information.
Types of Event Data
Some common types of event data include:
- Passes: Completed and attempted passes, including starting and ending locations.
- Shots: Shots on goal, including location, angle, and outcome (goal or no goal).
- Tackles: Successful and unsuccessful tackles, including location and players involved.
- Fouls: Fouls committed, including location and players involved.
Analyzing Event Data
Analyzing event data allows teams to gain insights into various aspects of the game. For example:
- Pass Networks: Visualizing pass networks to understand team passing patterns.
- Shot Maps: Plotting shot locations to identify high-value shooting areas.
- Expected Goals (xG): Calculating the probability of a shot resulting in a goal based on its location and other factors.
Expected Goals (xG) Explained
Expected Goals (xG) is a statistical metric that quantifies the probability of a shot resulting in a goal. It considers factors such as:
- Distance to Goal: Shots closer to the goal have a higher xG value.
- Angle to Goal: Shots from favorable angles have a higher xG value.
- Type of Shot: Headed shots, volleys, and other types of shots have different xG values.
- Defensive Pressure: The presence of defenders can lower the xG value.
By analyzing xG data, teams can evaluate the quality of their chances and identify areas for improvement.
Tracking Data: Unveiling Player Movement and Pitch Control
Tracking data provides a continuous record of the position of the ball and all players on the pitch, typically updated 25 times per second. This data allows for in-depth analysis of player movement, speed, acceleration, and pitch control.
Benefits of Tracking Data
Tracking data offers several benefits:
- Player Speed and Acceleration: Measure player speed and acceleration at any given moment.
- Distance Covered: Calculate the total distance covered by each player during a match.
- Pitch Control Models: Determine which team controls which areas of the pitch at any given time.
- Tactical Analysis: Analyze team formations, player positioning, and tactical strategies.
Pitch Control Models
Pitch control models use tracking data to determine which team is more likely to reach the ball first at any given point on the pitch. These models consider factors such as:
- Player Proximity: Which player is closest to the point in question.
- Player Speed and Direction: The speed and direction of each player’s movement.
- Probability Models: The likelihood of a player successfully controlling the ball upon arrival.
By visualizing pitch control, teams can gain insights into spatial dominance and identify areas where they need to improve their positioning and movement.
Player Evaluation: Statistical Models for Assessing Performance
Statistical models are used to evaluate individual player performance. These models consider various factors, such as goals scored, assists, pass completion rates, tackles, interceptions, and more.
Plus-Minus Models
A simple approach to player evaluation is the plus-minus model. Players are rewarded when their team scores a goal while they are on the pitch and penalized when their team concedes a goal. However, this model has limitations:
- Low Goal Frequency: Football has relatively few goals scored compared to other sports like basketball.
- Lack of Context: The model does not account for the skill of the opposition or the quality of teammates.
Advanced Player Evaluation Metrics
More advanced player evaluation metrics include:
- Pass Completion Rate: The percentage of passes a player successfully completes.
- Interceptions: The number of passes a player intercepts.
- Tackles: The number of successful tackles a player makes.
- Key Passes: Passes that lead to a shot on goal.
These metrics can be combined into a player radar, which provides a visual representation of a player’s strengths and weaknesses compared to other players in the same position.
Player Radar Example
A player radar might show a player’s performance in various categories, such as:
- Goals Scored: How many goals the player has scored per 90 minutes.
- Assists: How many assists the player has provided per 90 minutes.
- Pass Completion Rate: The percentage of passes the player successfully completes.
- Tackles: The number of successful tackles the player makes per 90 minutes.
- Interceptions: The number of passes the player intercepts per 90 minutes.
By comparing a player’s radar to those of other players in the same position, teams can gain insights into their relative strengths and weaknesses.
Match Result Simulations: Predicting the Unpredictable
Match result simulations use statistical models to predict the outcome of football matches. These models consider factors such as team strength, home advantage, and recent performance.
Poisson Regression
One common approach to match result simulation is Poisson regression. This model assumes that the number of goals scored by each team follows a Poisson distribution. The rate parameter of the Poisson distribution is determined by factors such as:
- Team Strength: The relative strength of each team, based on past performance.
- Home Advantage: The advantage that home teams typically have over away teams.
By fitting a Poisson regression model to historical match data, teams can estimate the rate at which each team scores against every other team, both at home and away. These rates can then be used to simulate a large number of matches and estimate the probability of each team winning, drawing, or losing.
Dixon-Coles Model
The Dixon-Coles model is an adjustment of the basic Poisson model that accounts for the fact that goals are not independent events. This model gives more weight to recent results and also accounts for the correlation between the number of goals scored by each team.
Case Studies: Football Mathematical in Action
Several high-profile football clubs have successfully implemented football mathematical techniques to gain a competitive edge.
Liverpool FC
Liverpool FC is known for its data-driven approach to player recruitment and tactical analysis. The club employs a team of data scientists who use statistical models to identify promising players and optimize team tactics.
FC Barcelona
FC Barcelona also uses data analytics extensively. The club’s head of sports analytics uses data to evaluate player performance, develop game plans, and make informed decisions about player recruitment.
Tools and Technologies
The field of football mathematical relies on a variety of tools and technologies:
- Python: A popular programming language for data analysis and statistical modeling.
- R: Another popular programming language for statistical computing and graphics.
- NumPy: A Python library for numerical computing.
- Pandas: A Python library for data manipulation and analysis.
- Matplotlib: A Python library for creating visualizations.
- Anaconda: A Python distribution that includes many popular data science libraries.
- SQL: A database query language used to extract and manipulate data.
Educational Opportunities in Football Mathematical
For those interested in pursuing a career in football mathematical, there are several educational opportunities available:
- University Courses: Some universities offer courses specifically focused on mathematical modeling of football.
- Online Courses: Many online platforms offer courses on data science, statistics, and machine learning that can be applied to football analysis.
- Workshops and Conferences: Attending workshops and conferences focused on sports analytics can provide valuable networking and learning opportunities.
The Future of Football Mathematical
The field of football mathematical is constantly evolving. As more data becomes available and new analytical techniques are developed, the insights that can be gained from data analysis will only continue to grow.
Emerging Trends
Some emerging trends in football mathematical include:
- Deep Learning: Using deep learning models to analyze video data and extract insights into player behavior and tactical strategies.
- Artificial Intelligence (AI): Developing AI-powered tools to assist with player recruitment, tactical planning, and in-game decision-making.
- Wearable Technology: Using wearable sensors to track player fitness and performance metrics in real-time.
Addressing the Challenges
Despite the many benefits of football mathematical, there are also challenges that need to be addressed:
- Data Quality: Ensuring the accuracy and reliability of data.
- Data Integration: Integrating data from multiple sources.
- Communication: Effectively communicating insights to coaches, players, and other stakeholders.
- Ethical Considerations: Using data responsibly and ethically.
Conclusion: Embracing the Power of Data in Football
Football mathematical is transforming the way the game is analyzed and understood. By leveraging data science and mathematical modeling, teams can gain a competitive edge in player recruitment, tactical planning, and in-game decision-making. As the field continues to evolve, the teams that embrace the power of data will be best positioned for success.
At CAUHOI2025.UK.COM, we are committed to providing you with the most accurate and up-to-date information on football mathematical. Whether you are a football fan, a data scientist, or a football professional, we hope this article has provided you with valuable insights into this exciting field.
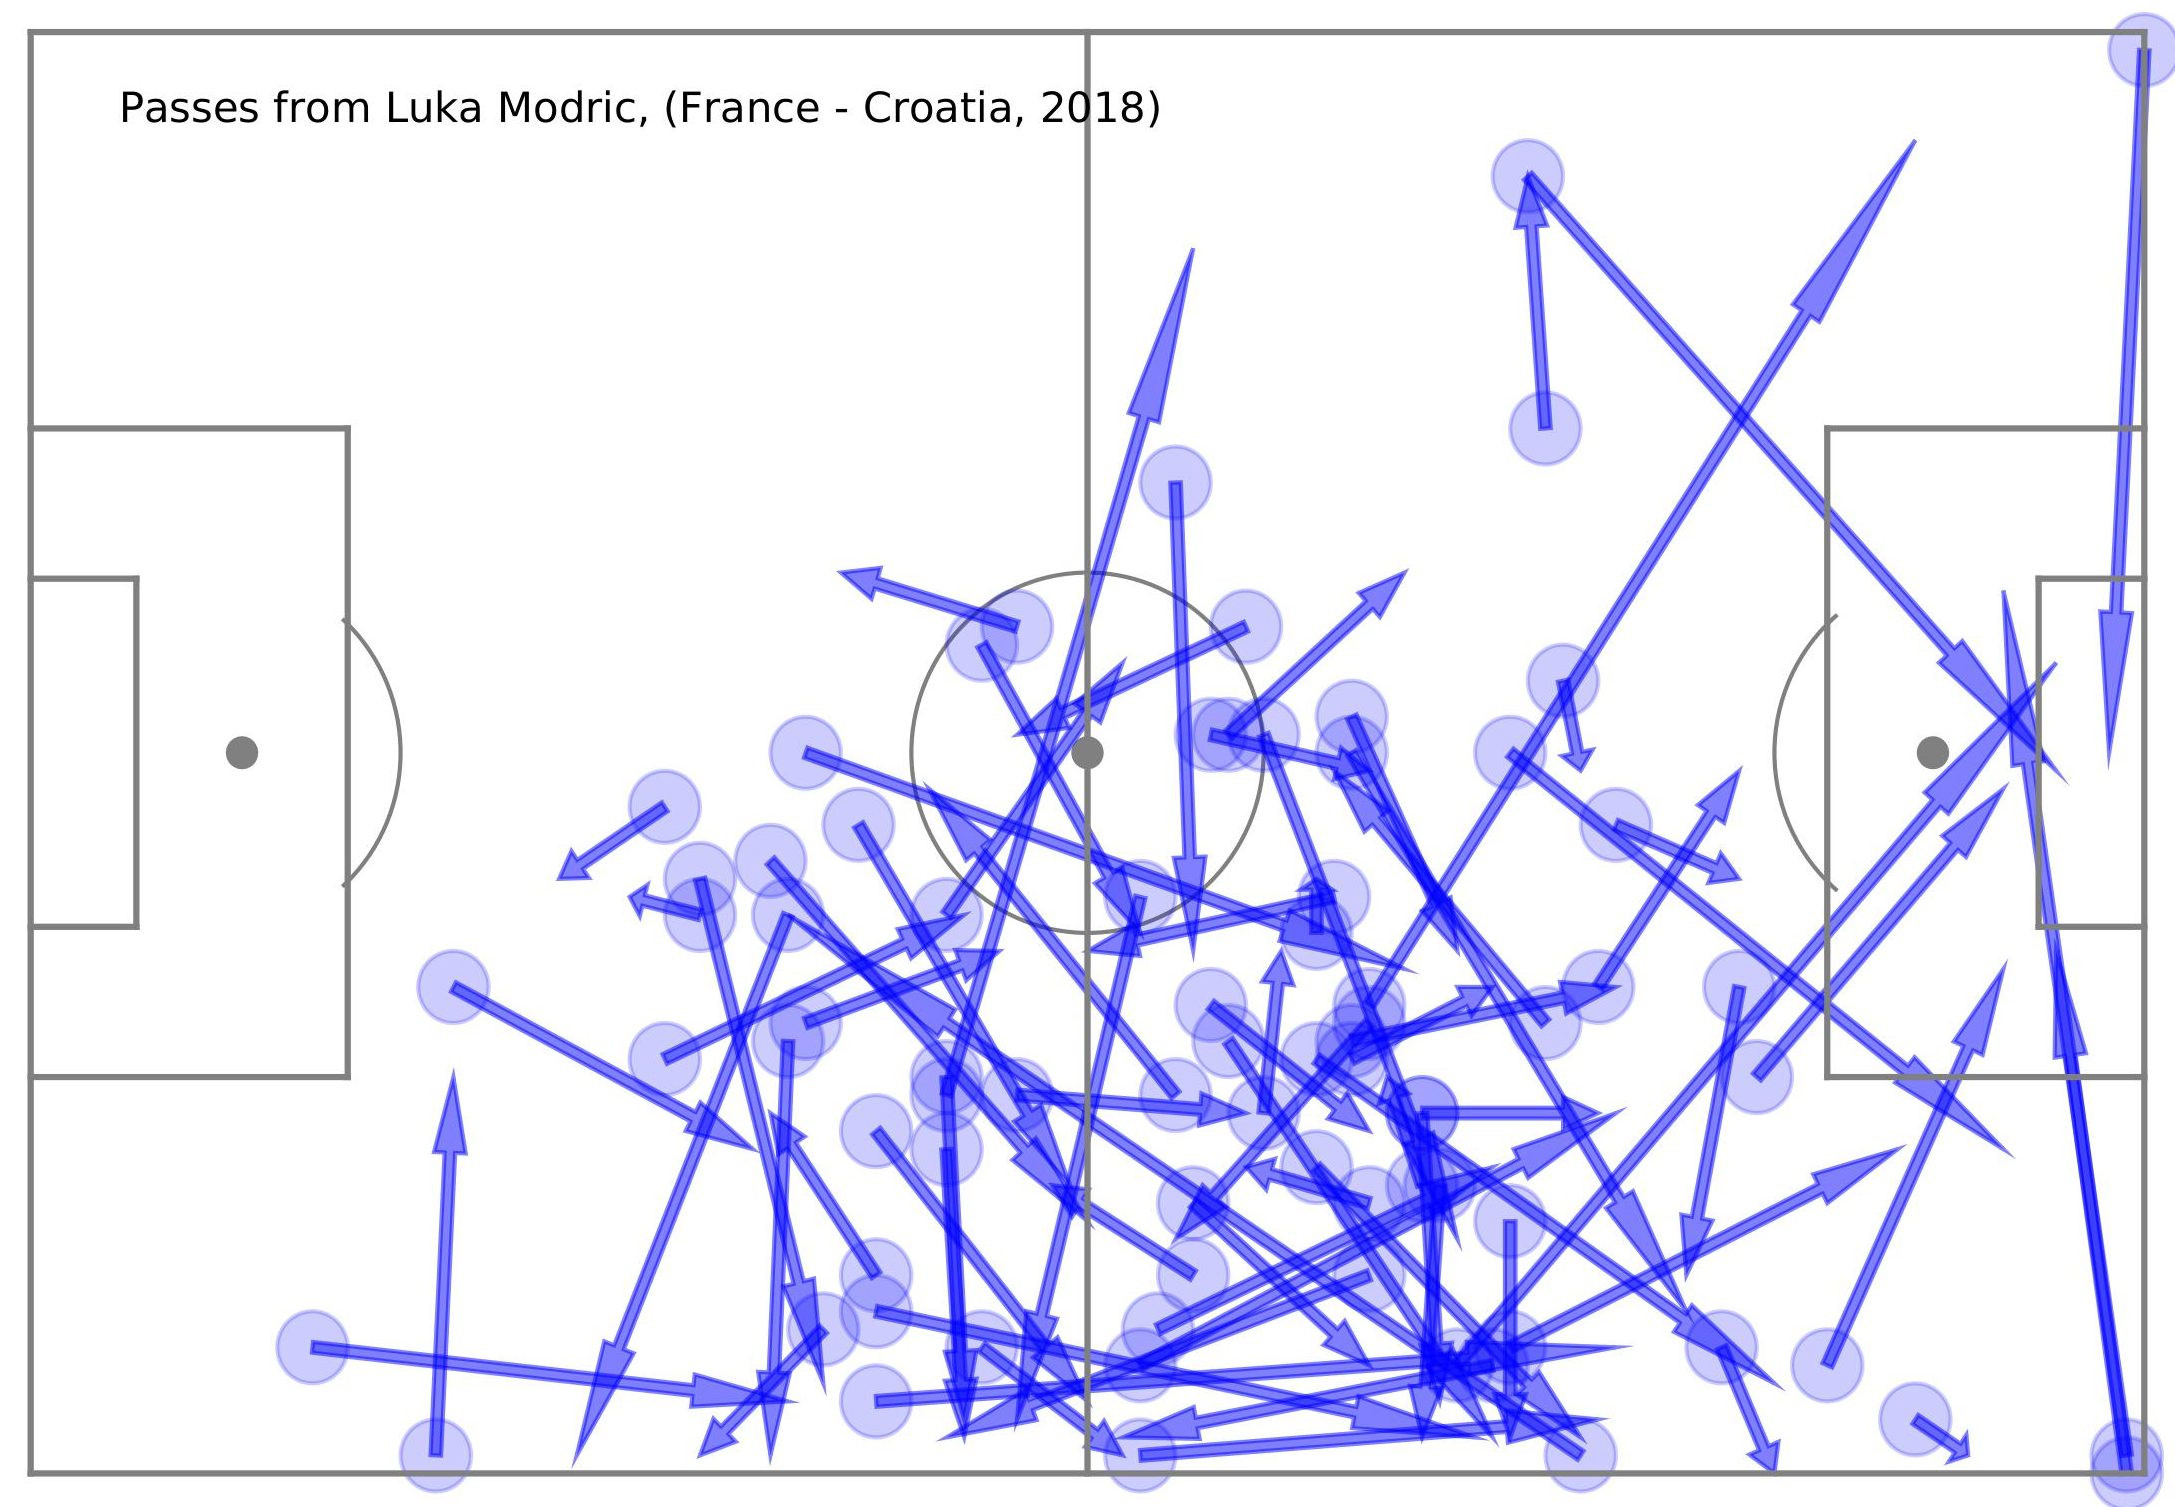 Luka Modric passes in the final match of the World Cup 2018
FAQ: Frequently Asked Questions about Football Mathematical
Here are some frequently asked questions about football mathematical:
-
What is football mathematical?
Football mathematical is the application of mathematical and statistical techniques to analyze and understand various aspects of football. -
Why is data important in football?
Data helps improve player performance, optimize team tactics, enhance scouting, and predict match outcomes. -
What is event data?
Event data includes actions with the ball like passes, shots, and tackles, recorded with timestamps and coordinates. -
What is Expected Goals (xG)?
xG is a metric that quantifies the probability of a shot resulting in a goal, considering factors like distance and angle. -
What is tracking data?
Tracking data continuously records the position of players and the ball, enabling analysis of movement and pitch control. -
How are players evaluated using statistics?
Statistical models assess performance using metrics like pass completion rate, interceptions, and tackles, often visualized in player radars. -
What is Poisson regression used for in football?
Poisson regression models the number of goals scored by each team, predicting match outcomes based on team strength and home advantage. -
Which clubs are known for using data analytics?
Liverpool FC and FC Barcelona are well-known for their data-driven approaches. -
What tools are used in football mathematical?
Common tools include Python, R, NumPy, Pandas, Matplotlib, Anaconda, and SQL. -
What are the challenges in using data in football?
Challenges include ensuring data quality, integrating data from various sources, and communicating insights effectively.
Ready to Learn More?
Explore the exciting world of “football mathematical” and discover how data is changing the game. Visit CAUHOI2025.UK.COM today for more in-depth articles, resources, and expert insights. Whether you’re looking to understand advanced analytics or simply want to learn more about the beautiful game, we’ve got you covered.
Have more questions? Our team of experts is ready to provide the answers and guidance you need. Contact us through our website or visit us at:
Equitable Life Building, 120 Broadway, New York, NY 10004, USA
Call us at: +1 (800) 555-0199.
Let CAUHOI2025.UK.COM be your trusted source for all things football and mathematics.
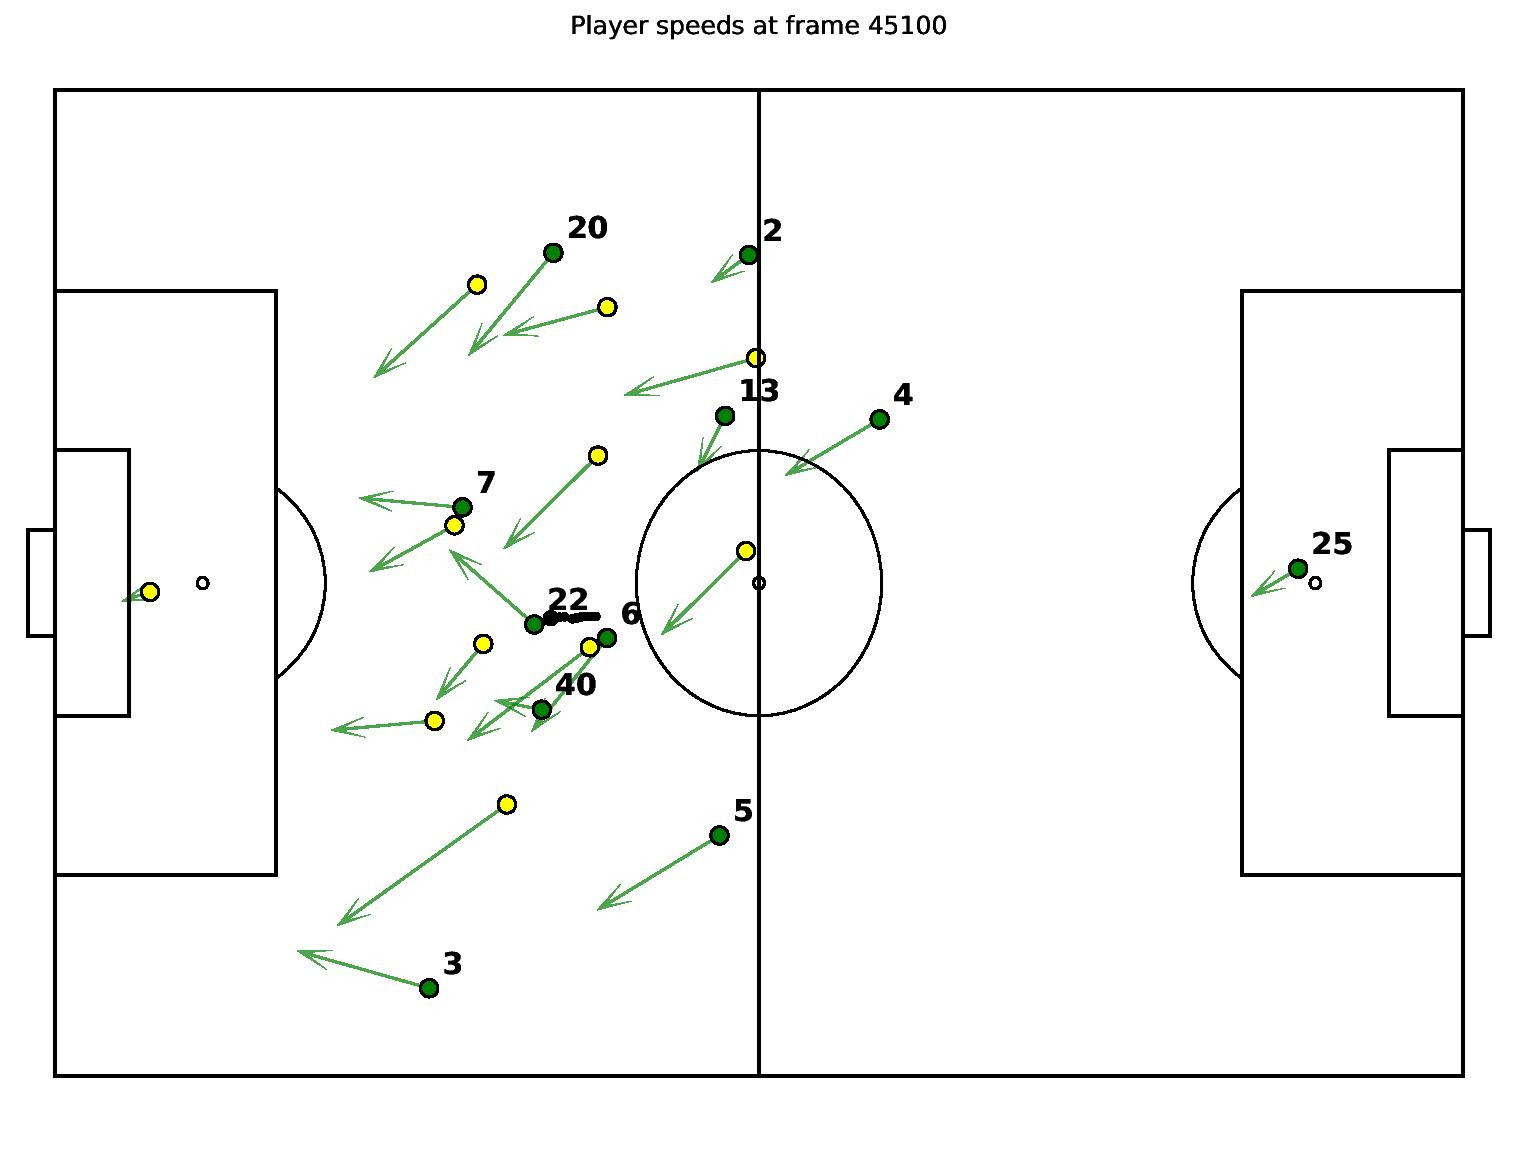 Speeds of Players Frame 45100
Call to Action
Are you fascinated by the power of data in football? Do you want to gain a deeper understanding of the strategies and tactics that drive success on the pitch? Visit CauHoi2025.UK.COM today to explore our comprehensive resources on “football mathematical.” Ask your questions, and let our experts guide you on a journey of discovery!